During the summer a news story on Global TV suggested one reason BC was quick to order a conservation officer to kill two bear cubs was because there were too few conservation officers to deal with all of the problem wildlife calls. The story was based in part on a key report prepared by the Society of BC Conservation Officers, Staffing Level Comparison 2001 to 2012, showing that the number of conservation officers who were actually out in the field has dropped by about 1/3 between 2001 and 2012, and considerably more in some regions, while demands on the Conservation Officer Service (COS) officers have increased over the same period. A couple of weeks ago the Conservation Officer, who had refused to kill the two bear cubs, was removed from his position and given alternate duties, a decision which is being challenged by the BC Government Employees Union.
West Coast was very interested to read the Global TV report, because it exposes a problem we’ve been concerned about for some time. BC’s Conservation Officer Service is actually at or near to historic staffing levels, but the levels of enforcement actions (as measured by tickets issues and convictions obtained) has been dropping fairly steadily for the past 25 years. The Society of BC Conservation Officer’s report, which relies on West Coast’s earlier documentation of this drop in enforcement, suggests enforcement of environmental laws has declined because more of the conservation officers are sitting behind desks.
Governments of all political stripes like to be on the side of strong law enforcement, but when it comes to environmental laws we generally don’t see evidence of such commitment. But if environmental criminals don’t need to worry about getting caught, then our environment is at risk even if, on paper, our laws are good.
Updating our enforcement stats
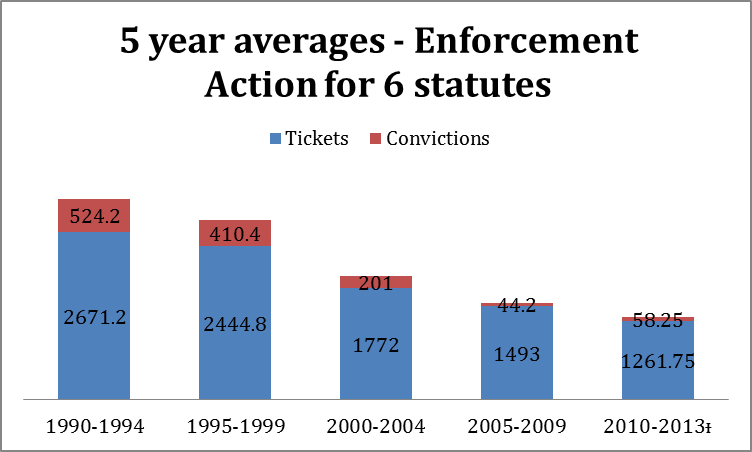
 In 2007 West Coast issued our first report on compliance figures, which we updated (and adjusted for changes in government reporting) in 2010.* For this update, we used 5 year averages to indicate general trends, and continue to report on enforcement of the Environmental Management Act, Fisheries Act, Integrated Pest Management Act, Migratory Bird Convention Act,Water Act, and Wildlife Act. Previously we’ve graphed the statistics for each year, but it can be difficult to see trends when you do that. (Click here if you want to see the updated graph with data for each year). One note – the last period is for 4 years, not five, since the government has yet to release its final 2014 figures (we’re told that may happen sometime this month).
By focusing on 5 year averages, it seems clear that BC has not just established a new normal for low environmental enforcement, but that the enforcement levels continue to drop. Although there has been a welcome - albeit slight - increase in convictions (as opposed to tickets) during the last period, they are still well behind where we were even a decade ago.
Are there feet on the ground?
We’ve long known that part of the reason for the drop in enforcement may have been a loss of field staff. In 2004 the province hit a low of 120 full time Conservation Officers, down from a high of 152 in 1995, and, as we wrote in 2007:
The number of Conservation Officers peaked in 1995, with 152 full-time staff. In 2004, that number had dropped to 120 (five positions were vacant). Moreover, many of the positions for scientists, field staff and other staff that supported the COS had been eliminated, requiring Conservation Officers to spend more time at their desk, and to manage with less expertise in the field.
However, in 2005 the province began to reverse this trend, re-hiring Conservation Officers, until, in 2013, there were 156.5 FTE staff in the Conservation Officer Service (148 of whom were Officers), although there continued to be fewer Ministry of Environment staff generally to support the COS. Internal government speaking points dated June 2013 boasted that of these, in 2013/14 the COS had 128 FTE “boots on the ground”, up from 115 in 2009/2010.
So why did the enforcement levels not increase? Why were more staff still enforcing less?
It turns out that the government’s figures about “boots on the ground” may have been misleading. The Staffing Level Comparison Society of BC Conservation Officers Report prepared by written just a month before the May 2014 internal government speaking points, paint a very different picture. In the report, Darryl Struthers, President of the society, provides a series of tables illustrating (in his words) that:
the burden of work has been transferred to our field Conservation Officers over the past decade; yet their numbers have drastically declined. The tables also demonstrate that staffing levels have not recovered since positions were lost and offices were closed in 2001.
According to the report, from 2001-2012, there was a 32 percent reduction in “field officer response,” -- the number of officers who are able to respond to public complaints or requests for help.
Struthers figures confirm that the overall numbers of COS staff in 2012 was similar (just slightly lower than) 201 levels, but he says that the portion of the COS staff able to actually investigate environmental crimes and respond to complaints is much lower.
We’ve graphed Struther’s figures 2001 and 2012 figures for each region.
Struthers concludes that the “field strength” of the COS declined from a total of 132 in 2001 to 90 in 2012, representing a total a decrease of one third. In 2001, 92% of Conservation Officer deployment was available to conduct field work and call response. By 2012, that number had dropped to only 64%. Struthers also links this loss of field strength to declining enforcement, citing our 2010 blog posts on the subject. According to Struthers' figures, at least, many of the 128 “boots on the ground” that the province referred to were actually sitting at desks.
What level of enforcement is appropriate?
Struthers also makes this important observation about the increased demands on Conservation Officers:
For Fiscal Year 2002/03 the RAPP line received 2119 poaching/polluting calls and 8094 [problem wildlife] complaints. For FY 2011/12 the RAPP line received 4826 poaching/ polluting calls and 26779 [problem wildlife] complaints.
So we know that members of the public are reporting over twice as many alleged offences (and over three times as many problem wildlife) as was the case 10 years ago, while at a time that the conservation service is issuing half as many tickets, and getting about a tenth as many convictions.
That’s consistent with other indications that the government is not detecting and punishing polluters and other violators. For example, a few government interns on a boat one summer were able to detect some 3,500 apparent violations of BC’s Water Act on 24 lakes. As Globe and Mail reporter, Mark Hume, put it:
On two dozen lakes selected from around the province, researchers found 420 private property Water Act permits had been issued – but more than 4,000 waterfront “modifications” had been done. That means more than 3,500 lakeshore projects were apparently built without authorization. … This isn’t just a case of widespread non-compliance – it’s an epidemic.
On the more anecdotal side, I recently spoke with a woman who called West Coast for help because she has tried repeatedly to get the province to enforce the Water Act in relation to illegal diversions of water, without success. It’s getting pretty bad if the government can’t enforce its environmental legislation even when people identify the violations for the Conservation Office and are filing complaints about the violations.
What does this say about how British Columbians value their environment?
What does it say when people know they can break environmental laws without fear of being reprimanded? When enforcement of environmental laws is low, it implies that society doesn’t care about the environment (or even its own clean water and air). Yet at West Coast, we know that British Columbians care passionately. Currently there is a discrepancy between what our laws say and what is happening on the ground, and between people who want strong environmental protection and governments that aren’t following through.
The BC Ministry of Environment has released its Service Plan for the period 2015-2018. It estimates that $15 million was budgeted for the Conservation Officer Service in 2014/2015 and in 2015/2016. This number is down from $18.7 million in 2007/2008. It is unclear how staffing problems are expected to be solved if the Ministry’s resources are not increased.
Clearly the BC government needs to do more to hold environmental violators accountable. As we’ve reported recently, the Ministry of Environment is looking at some interesting approaches – publicly shaming offenders, administrative penalties. But these solutions still require the government to detect violations, gather evidence and take action. And apparently that is still not happening.
By Andrew Gage, Staff Counsel and Justine Desmond, Summer Student
* - West Coast Environmental Law issued a report in 2007 called No Response chronicling enforcement trends for several of BC’s key environmental laws. The report used government figures related to the number of tickets issued and charges laid. In 2006, the Province began reporting on its enforcement efforts, but instead of reporting on charges laid, now reports on convictions (i.e., after a court has ruled on the charges). For our 2010 updates, we re-analyzed the earlier data, only including those charges that had a penalty associated with it, reasoning that if a penalty was levied, this mean that there must have been a conviction. We understand that the government disputes our earlier figures for convictions, believing that they still relate to all charges (which is not correct). However, we have asked the government for their pre-2006 figures for convictions, and these have not been provided.
ᵻ - Since the province has not yet released 2014 enforcement statistics, we have averaged the 2001-2013 period for this graph over the past 4 years, not 5.