One year to go until BC’s next election - what role will defending our natural environment play? Read on to see what the polling is telling us, and to share your ideas in keeping the environment front and centre in the lead up to the election.
A recent poll from Insights West contains good and bad news for environmentally-minded voters, but nonetheless reminds us that the environment can and should play a major role in the coming election.
While other issues polled ahead of the environment as their top issue of concern (Housing/Poverty/Homelessness at 22%; Economy/Jobs at 20%), the environment polled (at 9%) as one of British Columbian’s top five issues of concern – ahead of issues that are often viewed as more central in elections – like education, crime/public safety. On Vancouver Island, the environment was in the top 3 issues at 17%.
One also wonders if the “environment” might have done better if it had been characterized as “Clear air and water/healthy fish/environment” – giving a similar level of detail/emotional punch as “poverty” or “jobs”.
Nonetheless, significant numbers of voters in all parties listed the environment as “the most important issue facing British Columbia today.”* The poll did not ask what portion viewed the environment as an important issue – they got to pick just one issue.
- 21% of Green voters listed the environment as their top issue – the top choice within the Green Party.
- 11% of NDP voters said that the environment was their top issue, putting the environment in a 3 way tie for third place within that party – along with jobs/economy and education.
- 7% of Liberal voters selected the environment as the most important issue – but that was enough to put the issue in a tie for 5th place with a major plank of the Liberal election platform – energy/pipelines/LNG.
- Even 6% of BC Conservative voters listed the environment as their most important issue, which is a 4-way tie for fourth place (along with government accountability, crime/public safety and energy/pipelines/LNG).
Would we like to see more people listing the environment as their top issue? Of course. But in every party, the environment was one of the 5 top issues, and it’s a fair bet that the number of people who see the environment as an important issue is much, much larger.
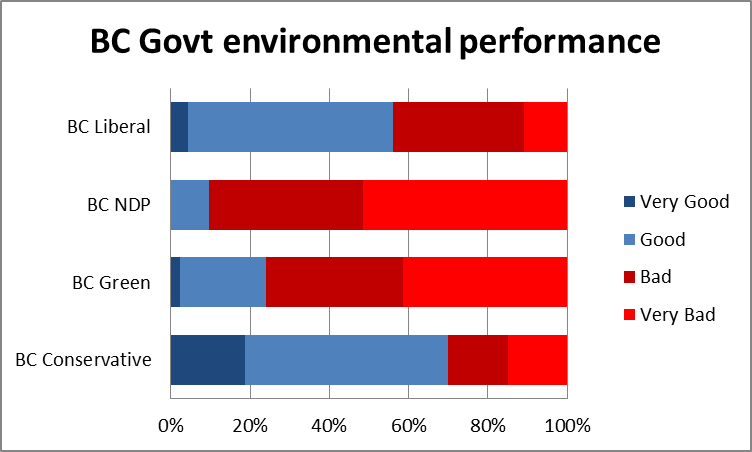
And when we how the government is doing on the environment, voters from each of the main parties give us interesting results.**
Over 40% of 2013 BC Liberal voters who have an opinion on the government’s environmental management are not impressed. BC Conservative voters were quite a bit more positive about the government’s environmental track record, but even then 30% didn’t like it. And clearly NDP and Green voters want to see more environmental leadership.
All parties ignore the environment at their peril.
So how is the government perceived as doing on specific environmental issues?
The Insights West poll also gives some intriguing insights into how the government is seen as doing on a range of more specific issues, including some environmental issues.*
Clearly there is a lot of dissatisfaction with the government’s handling of environmental issues, and a lot of potential to raise these issues in a provincial election. There is also time for the government to take new action to improve their environmental track record between now and the election.
Do you have thoughts on what environmental issues will be key to next year’s election and how we can press all parties to do a better job of defending Supernatural BC? Let us know in the comments section, below.
By Andrew Gage, Staff Counsel
* - Insight West’s detailed polling data cross tabulates the answers to questions to reported votes cast in 2013, rather than to the intended 2017 vote. We also note that since concern about “pipelines” was listed as a separate issue, it is possible that environmental voters concerned about pipelines selected this category, meaning that the environmental score may be slightly higher.
** - These tables do not include voters who are “not sure” of the government’s opinions, which for most questions is in the 15-20% range. One notable exception is the question related to the Agricultural Land Commission, about which 35% were “not sure.”